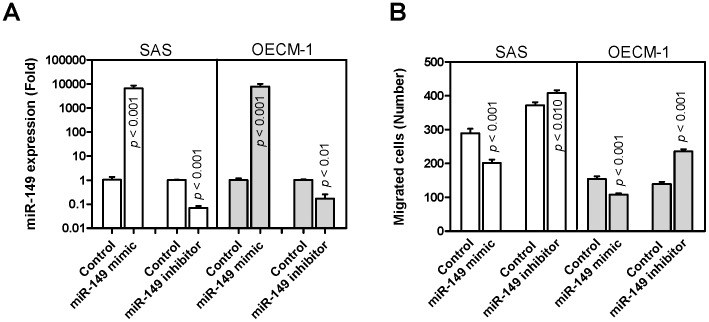
Figure 2. miR-149 expression and HNSCC cell migration.
SAS and OECM-1 cells were transfected with miR-149 mimic and miR-149 inhibitor. (A) qRT-PCR analysis. This detected increased miR-149 expression and decreased miR-149 expression following transfecting with miR-149 mimic and miR-149 inhibitor, respectively, relative to the controls. (B) Transwell migration assay. This indicated that transient miR-149 expression decreased cell migration, and knockdown of miR-149 expression increased cell migration. The results are means ± SE from at least triplicate analysis; un-paired t-test.

