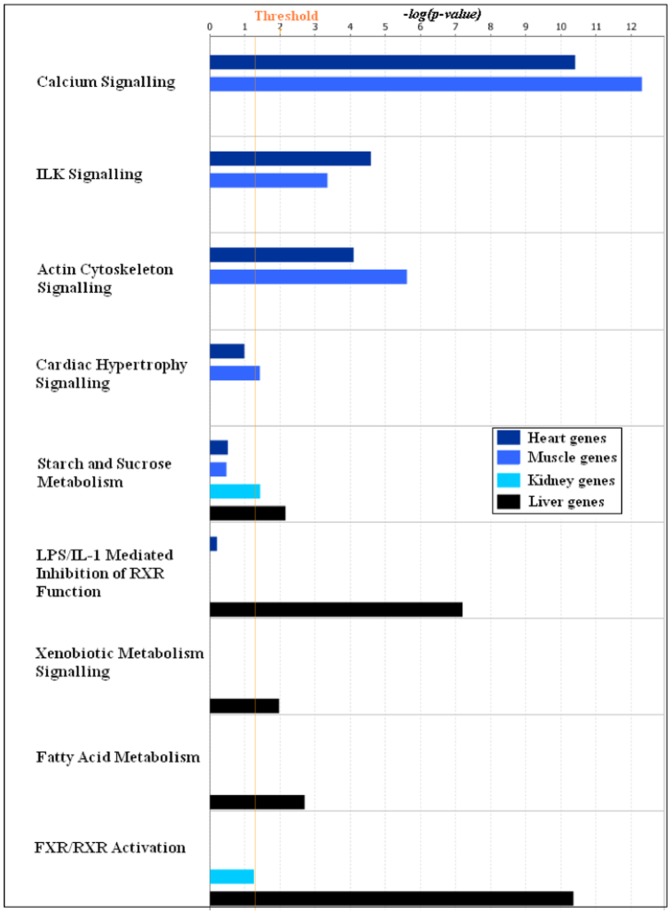
Figure 7. Enrichment of canonical pathways in the four tissue specific gene clusters.
The top one hundred most influential probe-sets in the four tissue specific gene clusters obtained in the first factorization were subjected to signalling and metabolic pathways analysis in the IPA software. This graph shows the comparison of canonical pathways enriched in the four tissue specific gene clusters,  ,
,  ,
,  and
and  . The coloured bars show the significance of the enrichment for a particular pathway in the cluster computed by Fisher's exact test.

