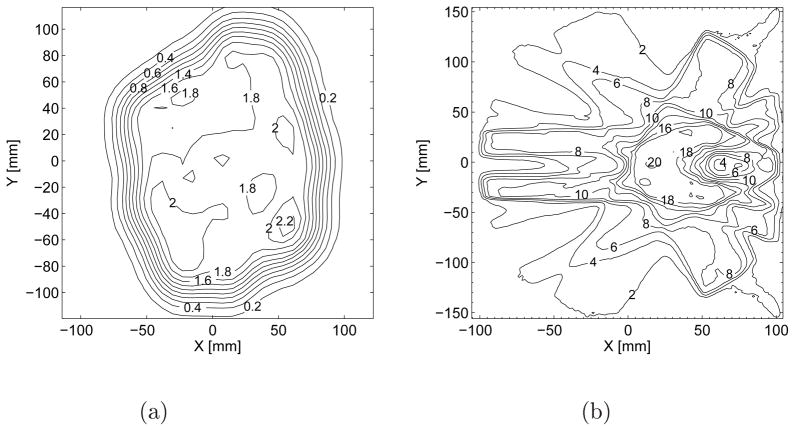
Figure 4.
(a) Measured proton PBS dose distribution at 162 mm depth of polystyrene for the treatment of osteosarcoma of the pelvis and (b) Simulated photon IMRT dose distributions at the plane containing the isocenter for the treatment of a spine tumor located around the spinal cord. The simulated photon distribution is corrected for an 18% normalization factor and then shifted in X by 0.1 mm for the purposes of this work to force the γ-index software to perform interpolation. The units of the contours in (a) and (b) are [GyRBE] and [Gy], respectively.

