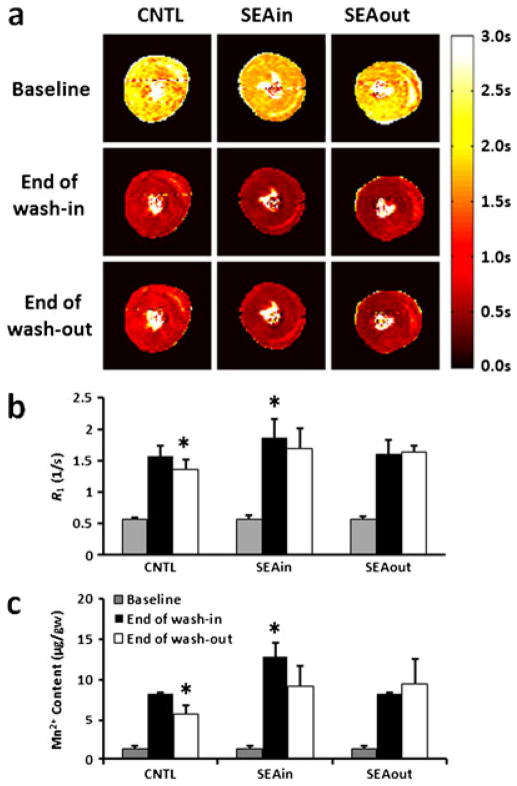
Figure 3.
Longitudinal relaxation time (T1), rate (R1) and manganese (Mn2+) content. (a) Representative T1 maps before Mn2+ perfusion (baseline), at the end of Mn2+ wash-in and at the end of wash-out. Relaxation rate (R1) (b) and Mn2+ content (c) at the corresponding time points. Sodium–calcium (Na+–Ca2+) exchanger (NCX) inhibition was induced by 1 μM SEA0400 during either Mn2+ perfusion (SEAin) or wash-out (SEAout). *p < 0.05 compared with the other two groups at the same time points. CNTL, control.

