
Figure 1. Expression of TFAP2C and ChIP-seq in Breast Cancer Lines.
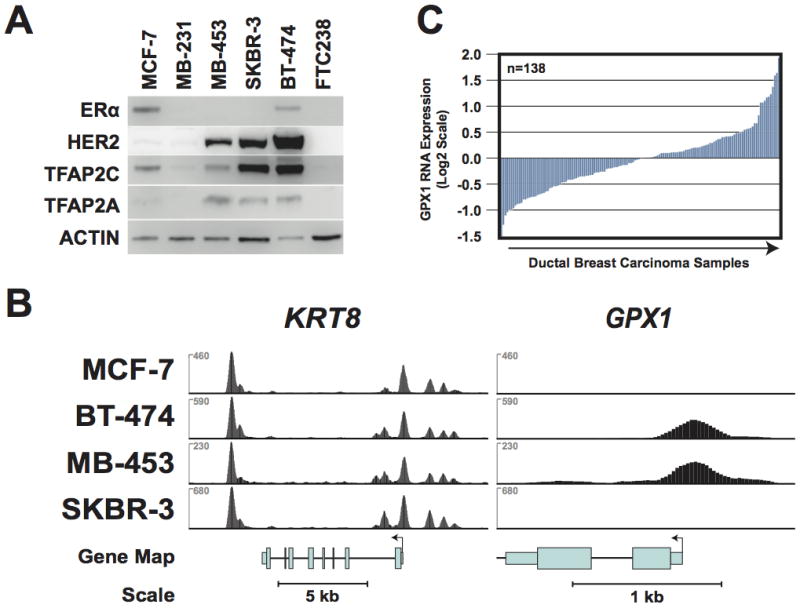
A. Western blots of cell lines shown demonstrate expression pattern for ERα, HER2, TFAP2C and TFAP2A. B. ChIP-seq data for TFAP2C genomic binding in breast cancer cell lines with the genome browser graphical output for the KRT8 and GPX1 genes. The y-axis represents normalized coverage (reads per million mapped) for all four cell lines with KRT8 and GPX1 presented to the same scale. C. Oncomine data of expression (log2 scale) of GPX1 in primary breast cancers.