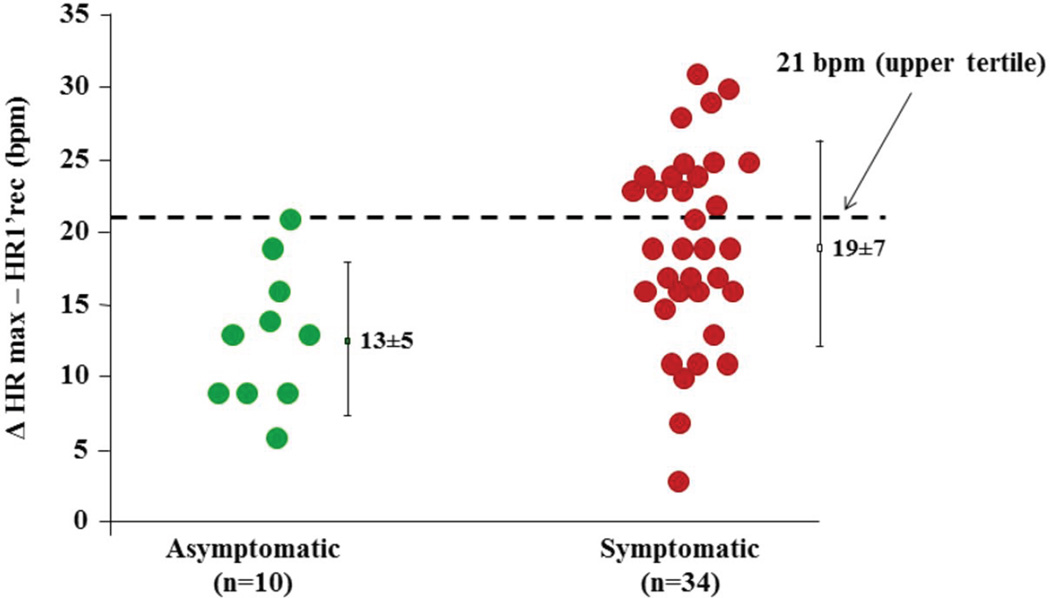
Figure 2. Post-exercise HR changes in the SA-LQT1 patients.
HR reduction from peak exercise to the first minute after cessation of exercise in the 44 SA patients off beta-blockers. The horizontal line at 21 bpm represents the upper tertile for the entire SA population (n=44), and values above this cut-off are associated with an increased risk for cardiac events.

