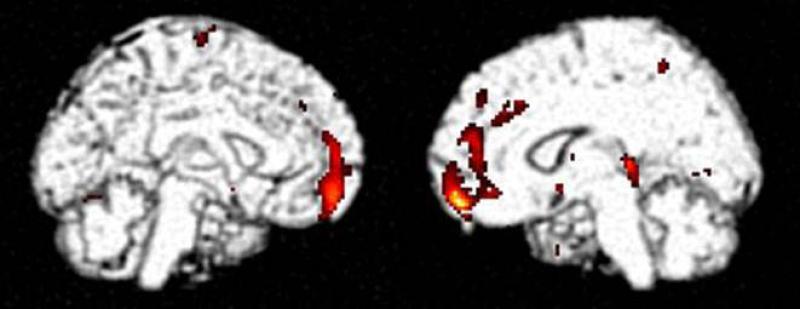
Figure 6.
Statistical parametric map of areas in brains of chemotherapy-exposed subjects having metabolism after one year longitudinal follow-up (n=11 chemotherapy exposed patients) that is significantly correlated with baseline plasma sTNF-RII . Colorscale reflects location of significantly correlated voxels, mapped upon co-registered grayscale structural template for anatomical reference; peak voxel p<0.0005, is located at (14, 56, -14) mm, and is part of a cluster of 501 contiguous voxels having p<0.01.

