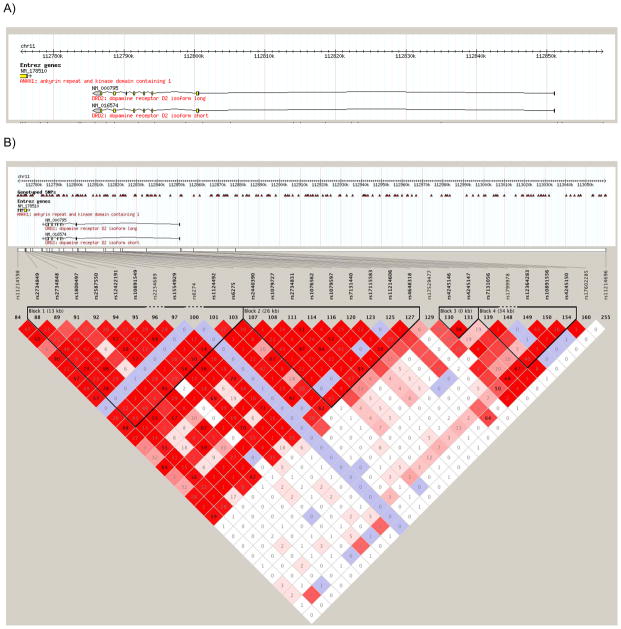
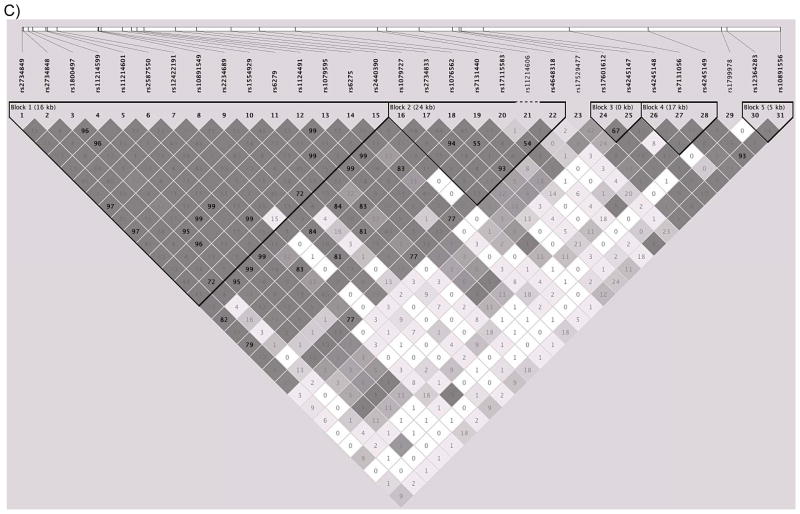
Figure 2.
LD structure of DRD2/ANKK1
Legend: Location of (A) and correlations between (B and C) the single-nucleotide polymorphisms (SNPs) genotyped in the DRD2/ANKK1 gene complex (B) in the CEPH (Centre d’Etude du Polymorphisme Humain) data obtained from the HapMap database (The International HapMap Consortium, 2003) and (C) in the Finntwin16 data, Shading indicates the degree of correlation as measured by D′ (Hedrick & Kumar, 2001); darker shading indicates higher correlations, and white shading indicates that markers are unlinked or uncorrelated. The numbers inside the diamonds are R2 values, another measure of correlation between SNPs. The black triangles grouping subsets of SNPs indicate blocks of SNPs that are highly correlated (as defined by criteria detailed in Gabriel et al., 2002). Not all SNPs genotyped in the Finntwin16 sample were available in the HapMap database; in these cases, proxy SNPs that were the SNPs most highly correlated with the genotyped SNPs are listed. In the Finntwin16 sample, the LD blocks were similar to those in the HapMap CEPH data, and the somewhat stronger LD between markers is in agreement with previous findings from the Finnish population (Service et al., 2006).


