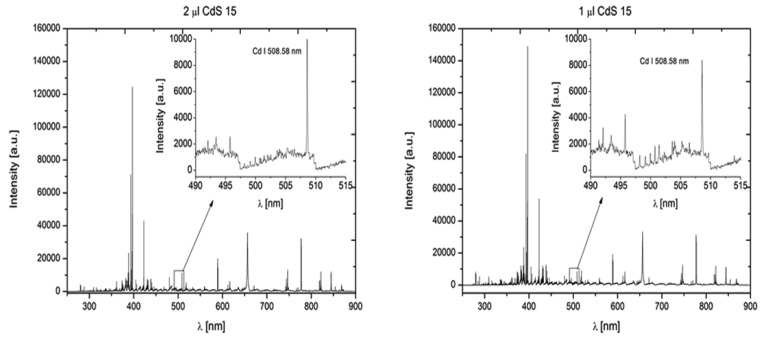
Figure 3.
Comparison of DP-LIBS spectrum for the CdS QDs sample of 1 μL and 2 μL volume. First laser—532 nm, pulse duration ∼10 ns, perpendicular direction to the sample surface, second laser—1,064 nm, pulse duration ∼6 ns, parallel direction to the sample. Spectral lines 508.58 nm for cadmium and 276.67 nm for tellurium.

