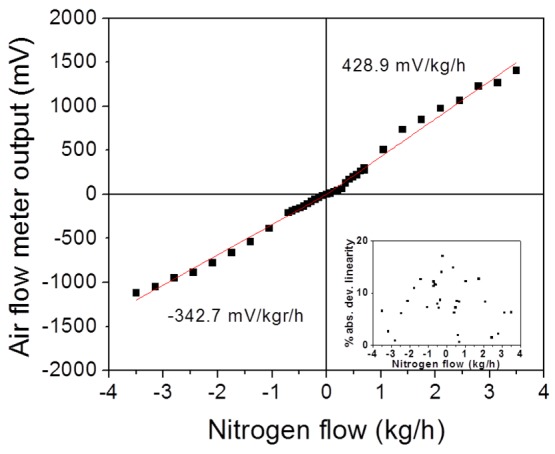
Figure 6.

Calibration curve of the air flow meter under nitrogen flow in forward and reverse flow directions, depicting quite symmetrical behavior in both directions. The points are the experimental results, while the red lines represent the linear fit to these points. The air flow meter response is remarkably linear with flow. The inset shows the absolute percent deviation from linearity for all data points. The deviation is less than 18% for all data points.
