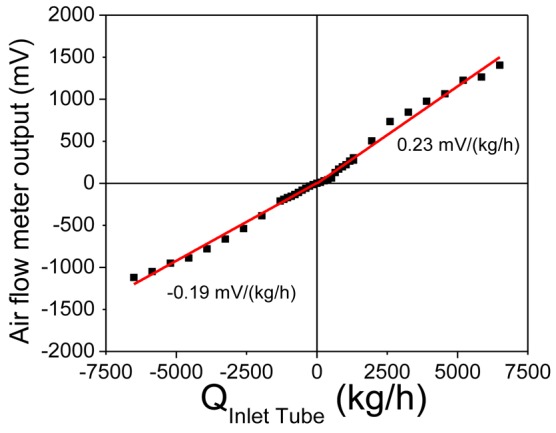
Figure 9.

Calibration curve of the air flow meter output as a function of air flow through the engine air inlet tube. Black squares are the experimental data, while the red lines represent the linear fit to these data in the forward and reverse flow directions.
