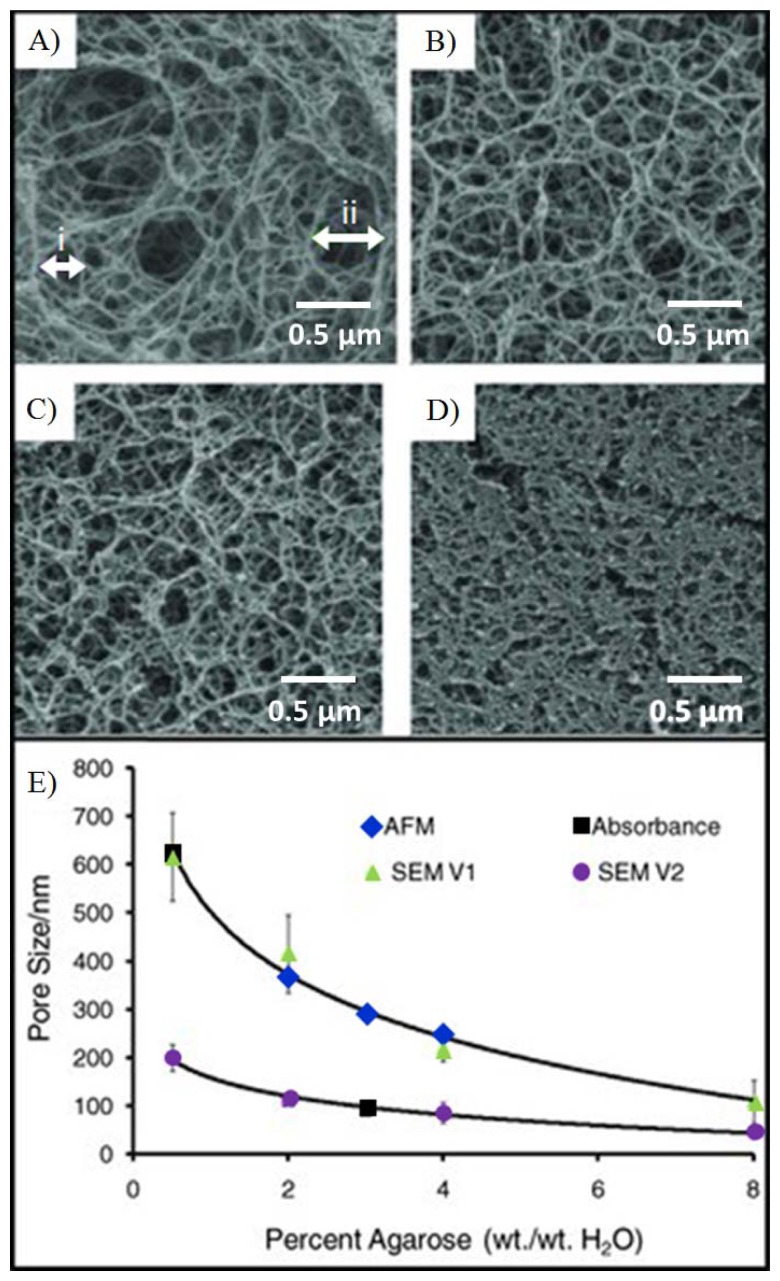
Figure 4.
Control of weight fraction of agarose content during production serves to tune the average pore size of the beads. The SEM images, showing (A) 0.5%, (B) 2%, (C) 4%, and (D) 8% agarose by weight, reveal the decrease in pore size as the density of agarose fibers increases. Scale bars labeled (i) and (ii) in panel A demonstrate measurements used to determine average pore size of bead concentrations from 0.5–8%. (E) This exponentially decreasing relationship of pore size as a function of agarose percentage, calculated from different microscopy techniques [74].

