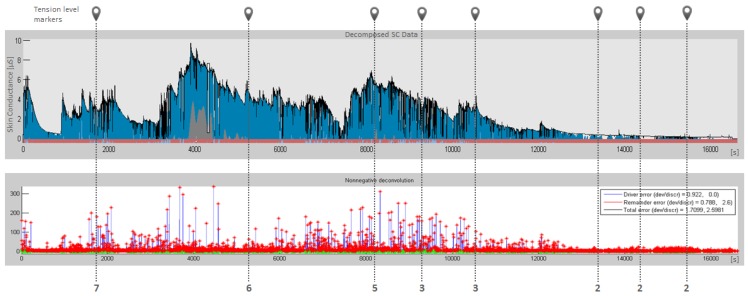
Figure 13.
Sequence of the decomposition of skin conductance data by means of nonnegative deconvolution (top). Tonic SC activity (grey) is separated from phasic SC data (blue). High-pass filtered EDA signal is shown (bottom). The red stars indicate the automatically detected SCR peaks. Tension level markers (vertical lines) show user's subjective estimation of his current stress condition answering questionnaire.

