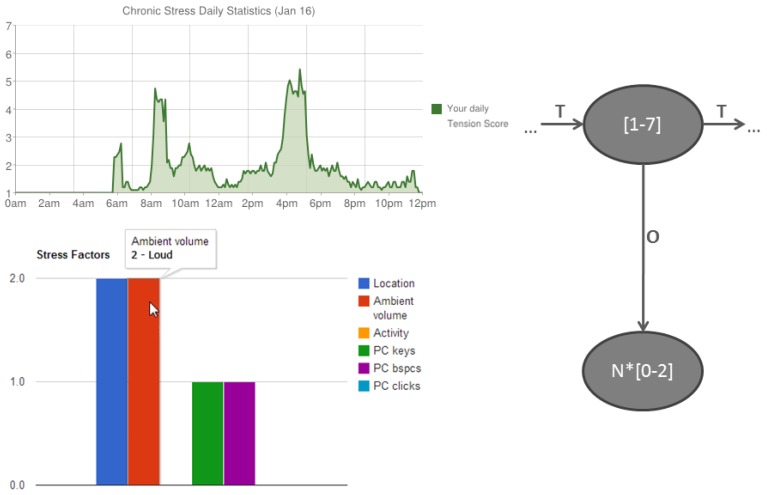
Figure 9.
User context triplets are visualized inside a Web graphical user interface in a descriptive form. The upper chart shows daily tension score statistics (values from 1 to 7) based on HMM states. While it is clickable user is able to overview the corresponding observations for each plotted tension score (the bottom chart).

