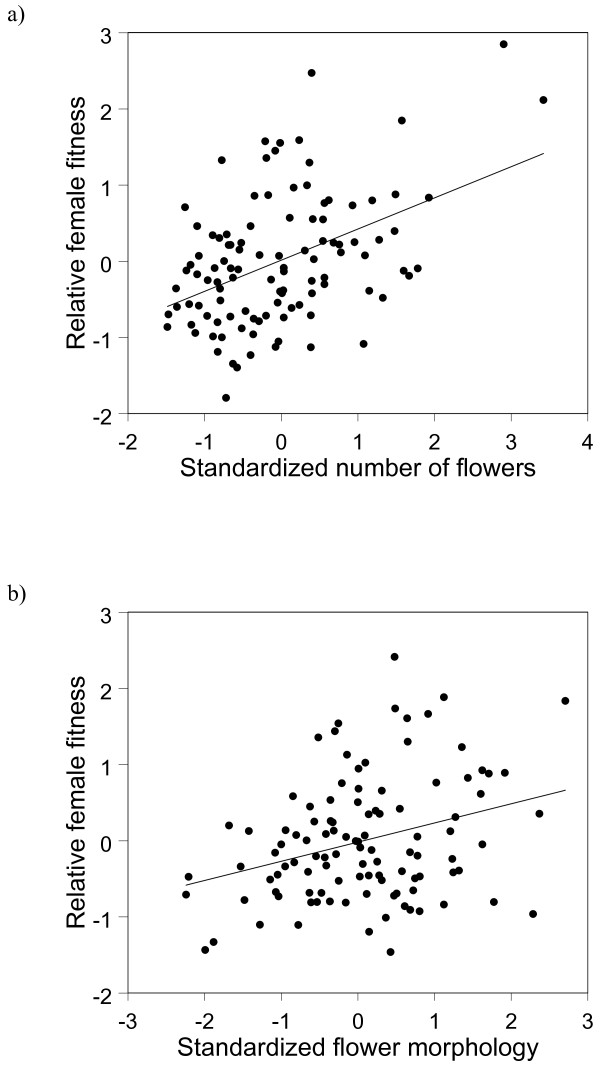
Figure 5.
Standardized linear phenotypic selection gradient for a) the number of flowers and b) floral morphology in a hybrid population of Orchis militaris and O. purpurea . The selection gradient is illustrated with an added-variable plot, in which the residuals from a linear regression model of relative fitness on all traits except the focal trait are plotted against the residuals from a regression model of the focal trait on the other traits.

