
Figure 2.
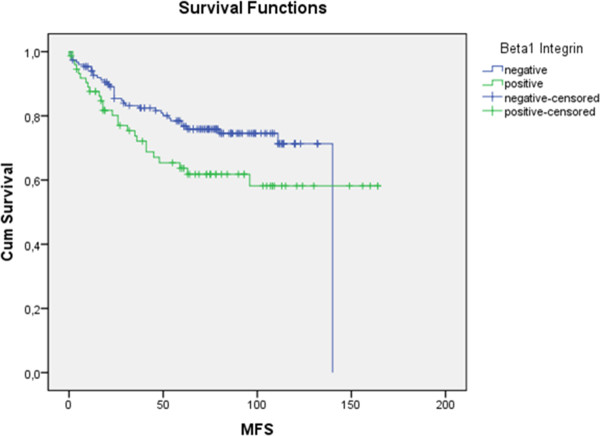
Kaplan-Meier survival curves: comparison of the expression of β1 integrin (green solid line) to negativity (blue solid line) in metastasis-free survival (MFS) demonstrating the non-significant (p = 0.061) but clearly divergent curves. (Using Kaplan-Meier table followed by log-rank test).