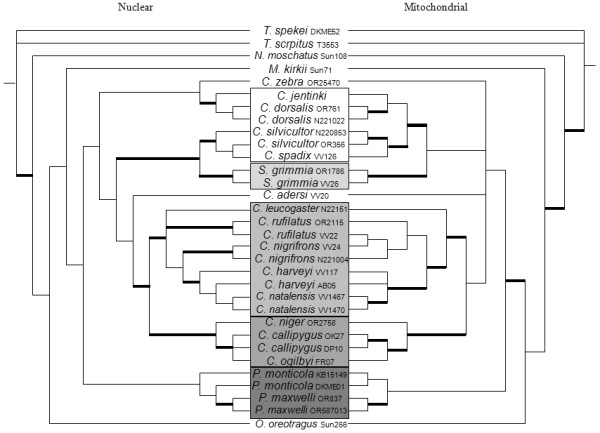
Figure 6.

Combined nuclear tree. Majority-rule consensus cladogram showing the Bayesian estimate of the species tree from nuclear concatenated (left) and mitochondrial datasets. Thickened branches nodal indicate support by both BA posterior probability (PP) values ≥ 0.95 and ML bootstrap support (BS) ≥ 75. Additional file 1: Table S1 lists support values by node for this phylogeny. Boxes show major lineages on a grey scale, starting with the giant duikers in white, then the savannah duiker, the east African red duikers, the west African red duikers, and the dwarf duikers in darkest grey.
