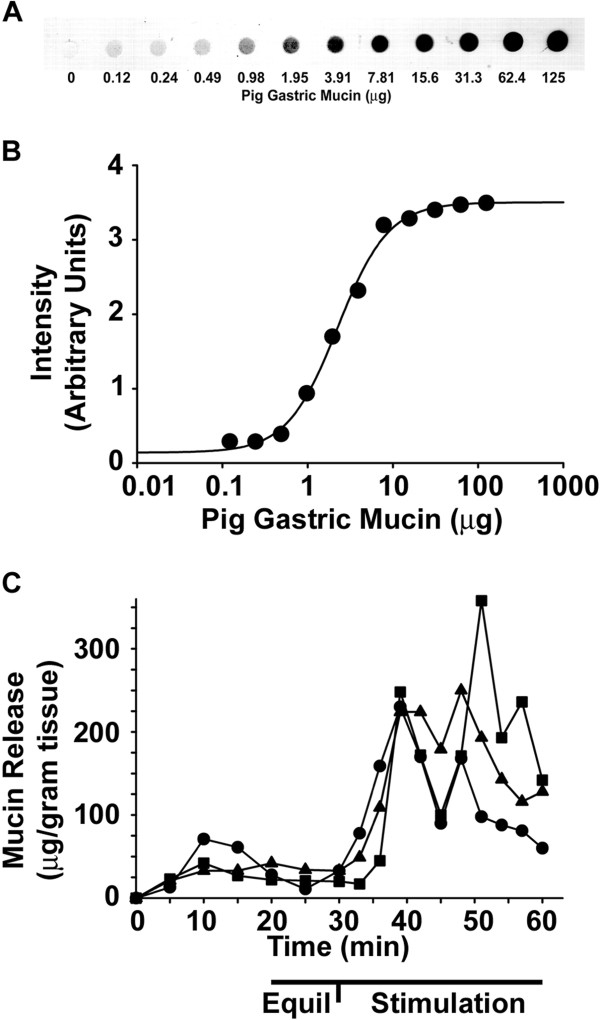
Figure 2.
Standard curve of pig gastric mucin and examples of PGE2-stimulated mucin release. (A) Example of the dilution series of pig gastric mucin. Purified pig gastric mucin was prepared in PBS and 2-fold serial dilutions were made. Mucin was applied to nitrocellulose membrane in a dot-blot apparatus followed by periodic acid Schiff’s reaction. The dried blot was imaged on a flatbed scanner and analyzed as described in the Methods. (B) Standard curve generated using SigmaPlot software. (n = 13 series of standards; R2 = 0.997) (C) Examples of mucin release before and after addition of PGE2 (1 μM final) to the bath (serosal) solution. The 20–30 min data (Equil) were used to measure the area under the curve for the unstimulated period, and 30–60 min data (Stimulation) were used to measure the area under the curve for the stimulated period (Figure 2)

