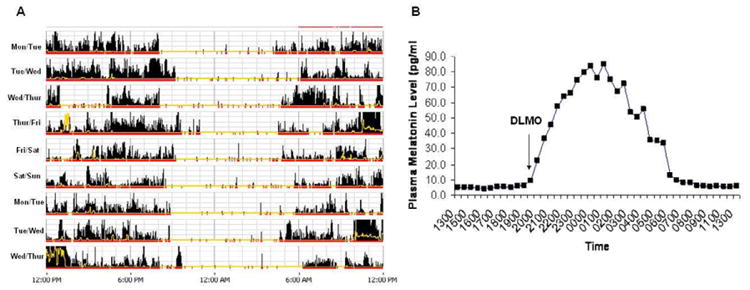
Figure 4. Actogram of a patient with ASPD.

Panel A shows an actogram derived from actigraphy data obtained over 9 days in a patient with severe ASPD. The yellow lines depict light exposure. The high amplitude dense bars are representative of wakefulness and no to low activity time is representative of sleep. Note that average sleep onset is 8:00 to 9:00 pm, and wake time from 4:00 to 5:00 am. Note the stable advance of the sleep–wake rhythm in relation to the conventional sleep time and wake-up time. Panel B shows the 24-hour plasma melatonin level rhythm of this patient. The dim light melatonin onset (DLMO) was defined as an absolute threshold at 10 pg/mL. The DLMO of this patient is advanced at 7.30 pm (which is approximately 2-3 hours earlier than would be expected in non-advanced persons).
