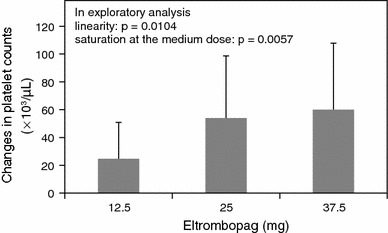
Fig. 3.

Changes from baseline in platelet counts at week 2. Exploratory analyses were conducted to detect a dose response and trend, using the changes from baseline in platelet counts at week 2. These data were analyzed using analysis of covariance (ANCOVA) with baseline platelet counts as a covariate, using contrast methods for the following dose response patterns: linearity in 3 doses [contrast of 12.5, 25 and 37.5 mg: −1 0 1], saturation at the medium dose (25 mg) [contrast: −2 1 1], and onset of response at the high dose (37.5 mg) [contrast: −1 −1 2]. No adjustment for multiplicity was made. Data are expressed as means + SD
