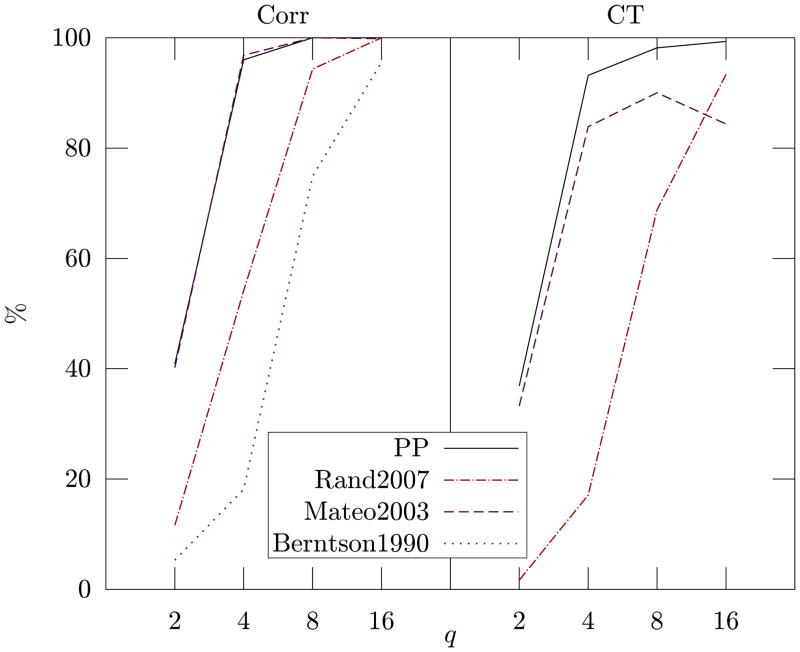
Fig. 3.
The left side of the plot (Corr) reports the percentage of the beats shifted by Δtr = q · RMSSDr (as detailed in Section III-A) that were correctly detected as erroneous. The right side of the plot (CT) shows the percentage of the same beats that were correctly classified as type “m” beats. For example, a shifted beat detected as extra beat would count as a hit for “Corr” but as a fail for “CT”.

