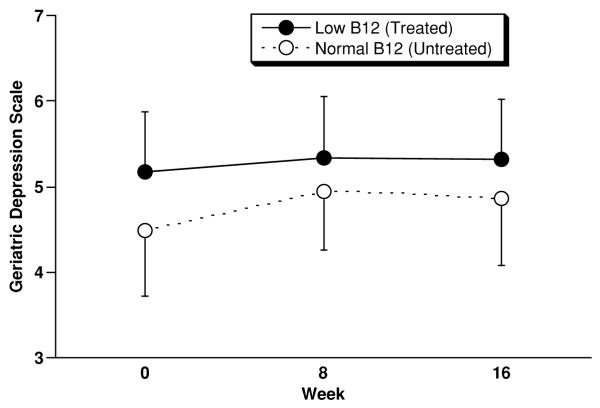
Figure 3.
Outcome on the Geriatric Depression Scale – abbreviated version (GDS) for low B12 (n=22) and normal B12 (n=21) subjects. Displayed values represent mean±SEM (SEM used for legibility). From 0 to 16 weeks low B12 subjects improved by 0.1±2.8 (SD) points, and normal B12 subjects improved by 0.3±2.5 points (F=0.00; df=1,40; p=0.97, ANCOVA).

