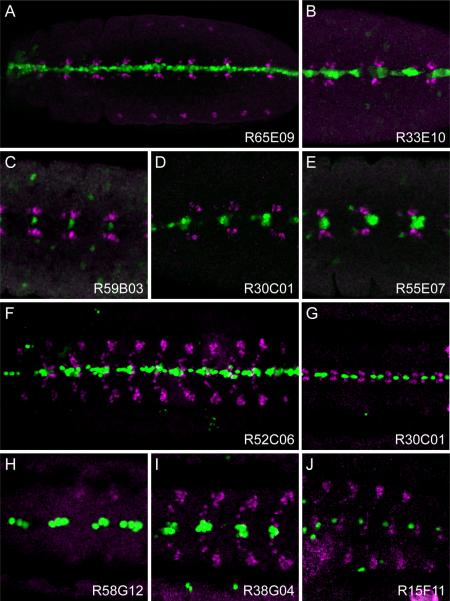
Figure 4. Representative GAL4 expression patterns in CNS midline cells.
(A–E) Images of GAL4 lines at GBE stages showing midline primordium staining of (A) all midline cells: Line R65E09, gene Tk; (B) a large subset: R33E10, gene ct; (C) a single cell: R59B03, gene CG8861; (D) a small subset of likely midline glia: Line R30C01, gene netB; and (E) a small subset of neural precursors or neurons: Line R55E07, gene CG13253.
(F–J) Images of stage 16 embryos showing (F) all midline cells: Line R52C06, gene cdi; (G) midline glia: Line R30C01, gene netB; (H) iVUMs: Line R58G12, gene Gad1; (I) MNB progeny: Line R38G04, gene sca; and (J) a single neuron: Line 15F11, gene Syt1.
All panels show ventral views of the CNS of the indicated GAL4 UAS-nGFP lines stained for Eve (magenta) and nuclear GFP (green). Ventral midline, arrowhead; anterior is to left.

