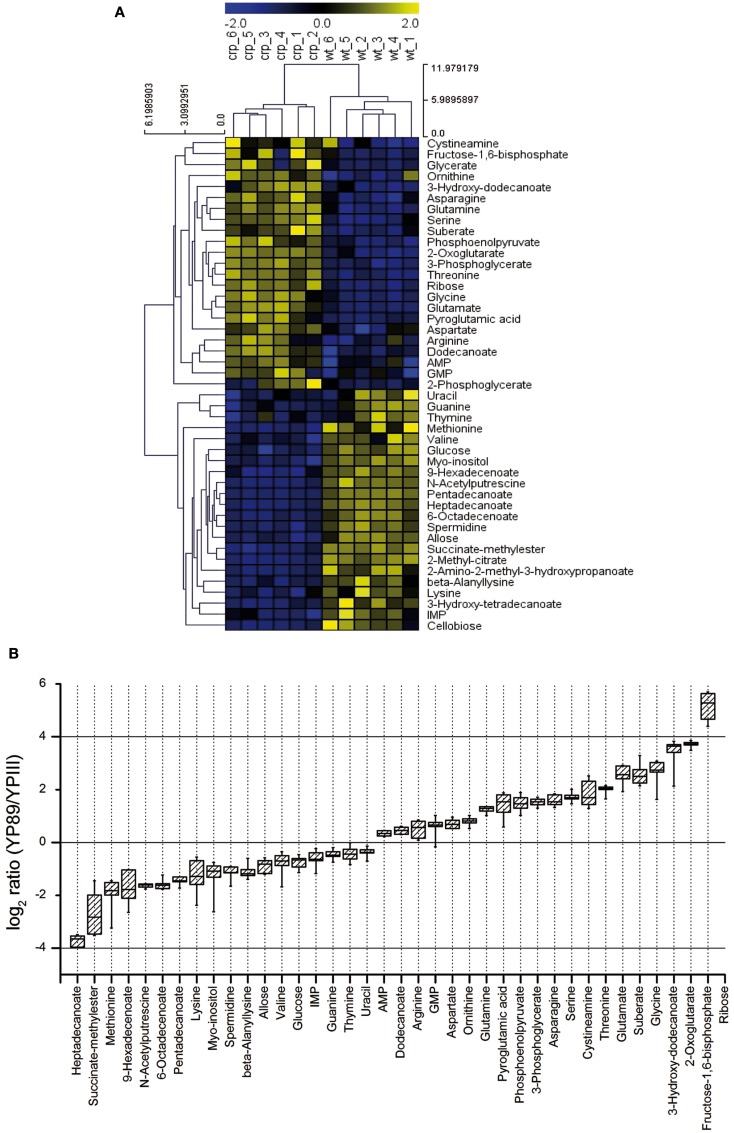
Figure 5.
Metabolic profiles of Y. pseudotuberculosis and the crp mutant. (A) The metabolite profile was determined from the Y. pseudotuberculosis wildtype strain YPIII and the isogenic Δcrp strain YP89 (six biological replicates for each strain). Unbiased hierarchical clustering was performed of 45 identified metabolites that were significantly changed in the mutant compared to wildtype (Student’s t-test, p-value < 0.05). Clustering was performed using average linkage and Euclidean distance. The analysis is visualized by a heatmap in which each square represents the normalized intensity of a metabolite. (B) Box-and-whisker plots illustrating metabolites that were significantly changed between the crp mutant and the wildtype grown in LB at 25°C.

