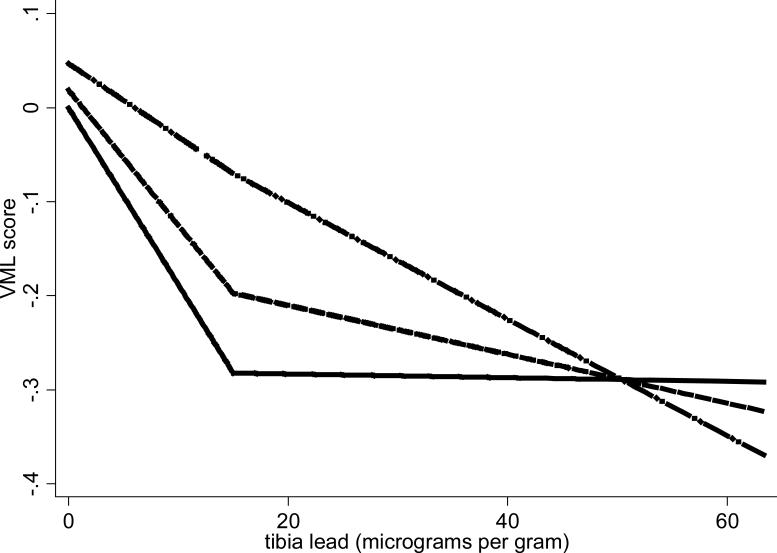
Figure 1.
Graphical display of the estimated decline in verbal memory and learning with increasing tibia lead levels by study visit in subjects of white race/ethnicity only, Baltimore Memory Study, 2001-2005. The solid line represents the fully adjusted association of tibia lead with the verbal memory and learning cognitive domain score at baseline, the dashed line the same association at the first follow-up visit, and the dash-dot line at the second follow-up visit. First and second follow-up curves are estimated for respective timings of 1 year and 2.5 years from baseline.

