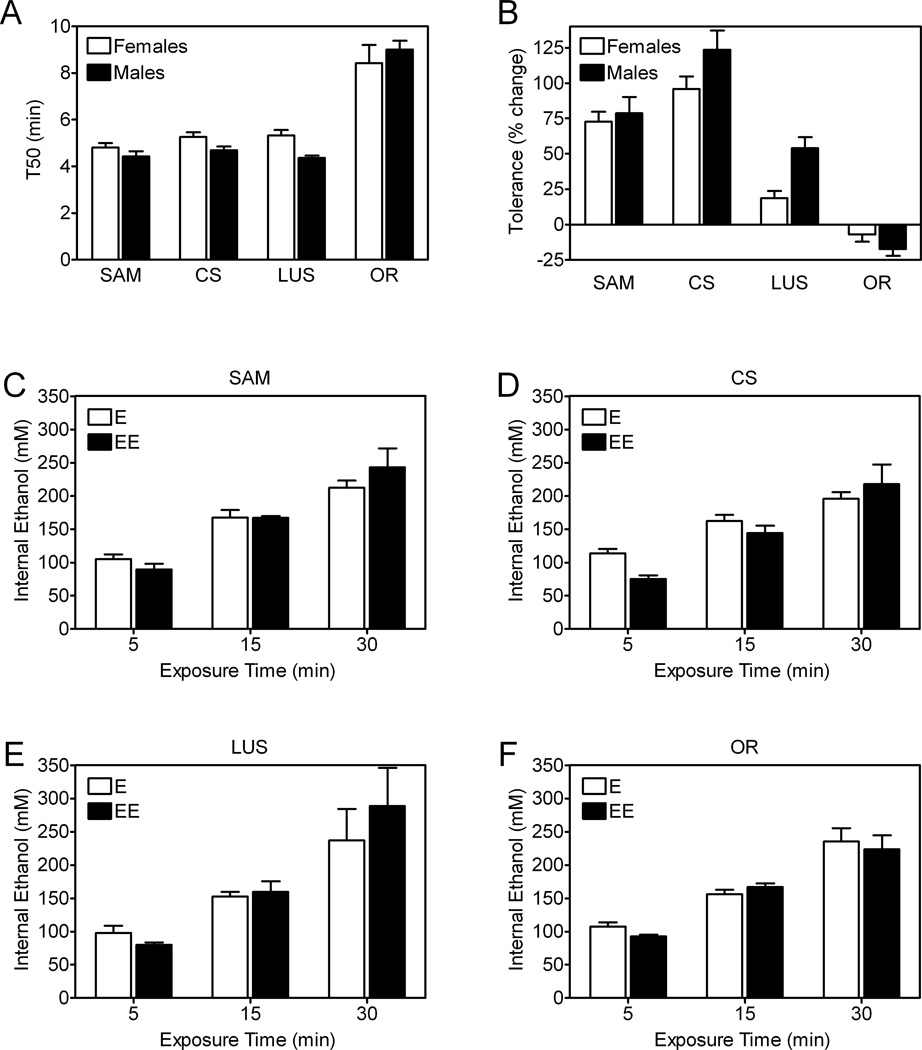
Figure 5. Effect of sex and genetic background on ethanol sensitivity and rapid ethanol tolerance in eRING assays.
Males and females of four different genetic backgrounds (Samarkand (SAM), Canton-S (CS), Lausanne (LUS) and Oregon-R (OR)) were assessed in eRING assays for ethanol sensitivity (A), development of rapid ethanol tolerance (B), and internal ethanol concentrations (C-F) during exposure to vapor from a 50% ethanol solution. (A) Genetic background, but not sex, affected T50 values for ethanol sensitivity (two-way ANOVA: genetic background, p<0.0001; sex, n.s.). The T50 values for OR males and females were significantly higher than all other genetic backgrounds tested (Bonferroni’s multiple comparison test, p<0.05). (B) The development of rapid ethanol tolerance was significantly affected by genetic background, but not sex (two-way ANOVA: genetic background, p<0.0001; sex, n.s.). Internal ethanol concentrations in SAM (C), CS (D), LUS (E) and OR (F) males increased with the duration of ethanol exposure time, but were not affected by genetic background and were statistically indistinguishable during a first and second exposure (three-way ANOVA: time, p<0.0001; genetic background, n.s.; first vs. second exposure, n.s.). Data are mean ± S.E.M. in all panels. Data in panels A and B were compiled from three independent experiments for a total of 15 vials of 25 flies per genotype and sex. Data in panels C-F are from 18 vials total (25 flies/vial) for each strain.

