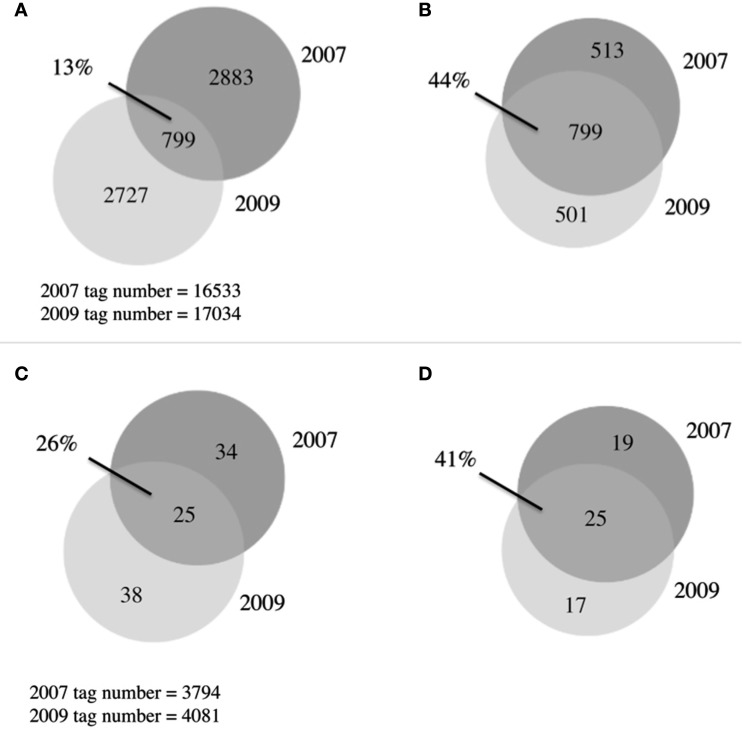
Figure 4.
Venn diagrams of microbial communities. (A) Overlap between 2007 and 2009 bacterial communities, OTUs defined at 97% similarity (B) As in (A) with singletons removed (C) overlap between 2007 and 2009 eukaryotic communities, OTUs defined at 94% similarity, (D) as in (C) with singletons removed.

