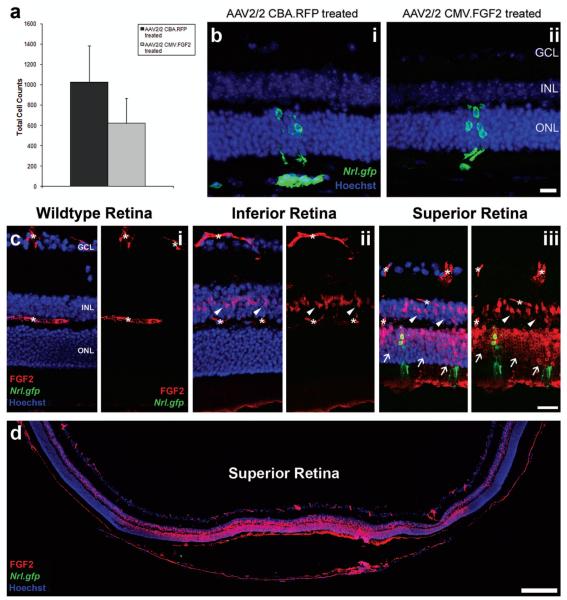
Figure 4.
The effects of FGF2 overexpression following retinal cell transplantation. (a) Histogram showing the total cell counts for AAV2/2-treated eyes. No significant difference in cell integration was observed for the AAV2/2 CMV.FGF2-treated eyes (mean ± SEM; *p > 0.05, paired t-test, N = 4). (b) Projection confocal images of retinal sections from eyes that have been transduced with either AAV2/2 CBA.RFP (b,i) or AAV2/2 CMV.FGF2 (b,ii), and received a subretinal cell transplantation. Integrated cells are present in both retinas (b,i, ii; Nrl.gfp; green). Scale bar: 20 μm. (c) Projection confocal images of retinal sections from a wild-type eye and transplanted eyes, respectively. No detectable FGF2 was present in the untreated wild-type retina (c,i; red); asterisks denote nonspecific blood vessel staining. Increased FGF2 was observed in Müller cell bodies in the inferior and superior hemispheres of a normal transplanted eye (c,ii, iii; white arrowheads). Integrated cells were present in the superior retina (c,iii; Nrl.gfp; green), the site of cell transplantation, as well as increased levels of FGF2 in the ONL (c,iii; red; white arrows). Scale bar: 50 μm. (d) Montage of single confocal images showing the increased levels of FGF2 (red) at the site of cell transplantation, the superior hemisphere. Nuclei were counterstained with Hoechst 33342 (blue). GCL, ganglion cell layer; INL, inner nuclear layer; ONL, outer nuclear layer. Scale bar: 200 μm.

