
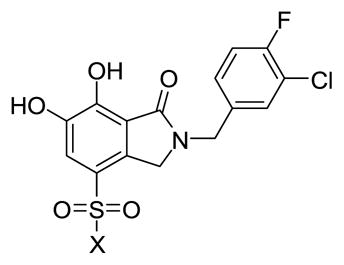
Table 2.
Inhibitory potencies using an in vitro IN assay.a
| |||
|---|---|---|---|
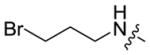
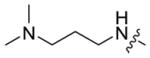
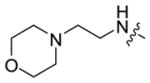
| No. | X | IC50 Values (μM)
|
|
| 3′-Processing | Strand transfer | ||
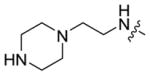
| 5a-1 | NHMe | 17.5 ± 3.0 | 0.12 ± 0.04 |
| 5a-2 | NEt2 | 9.5 ± 1.2 | 0.054 ± 0.009 |
| 5a-3 |
|
14.7 ± 1.7 | 0.11 ± 0.01 |
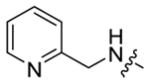
| 5a-4 |
|
15.9 ± 1.3 | 0.24 ± 0.02 |
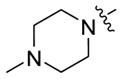
| 5a-5 |
|
30.2 ± 2.3 | 0.32 ± 0.05 |
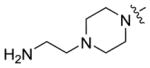
| 5a-6 |
|
19.3 ± 0.6 | 0.31 ± 0.03 |
| 5a-7 |
|
23 ± 3 | 0.37 ± 0.04 |
| 5a-8 |
|
23 ± 4 | 0.4 ± 0.08 |
| 5a-9 |
|
21.2 ± 1.9 | 0.19 ± 0.08 |
| 5a-10 |
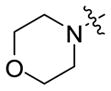
|
6.8 ± 1.1 | 0.047 ± 0.007 |
| 5a-11 |
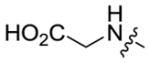
|
11.7 ± 0.7 | 0.08 ± 0.01 |
| 5a-12 |
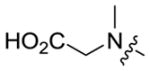
|
6.9 ± 0.6 | 0.058 ± 0.01 |
a
Assays were performed using a gel-based protocol with Mg2+ cofactor as described in reference 12.