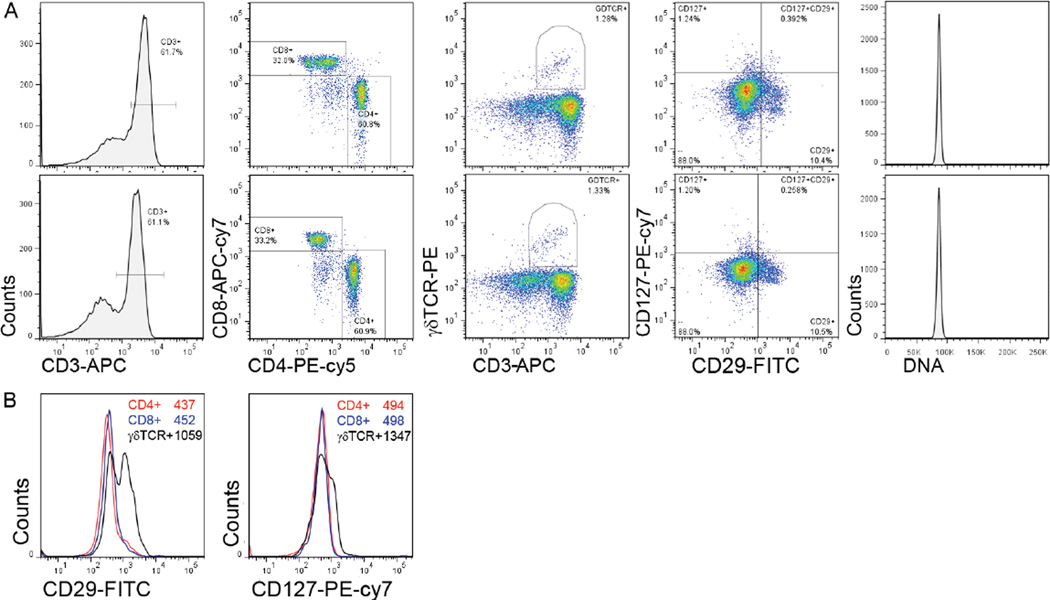
Figure 1. Seven-color flow cytometric analysis of freshly isolated lymphocytes by the classical and low-volume antibody staining methods.
(A) Histograms and pseudo color dot plots (from left to right) showing CD3-APC, CD4-PE-cy5/CD8-APC-cy7, CD3-APC/γδTCR-PE, CD29-FITC/CD127-PE-cy7, and Hoechst staining. The upper row shows the results of staining 2×10⁶ cells with 0.2 µg antibody in a 20 µL volume and the lower row shows results of staining 2×10⁶ cells with 1.0 µg antibody in a 100 µL volume. (B) Histograms depicting expression of CD29 and CD127 on CD4+ (red line), CD8+ (blue line), and γδTCR+ (black line) T cells. Mean fluorescence intensity (MFI) for each cell type is shown in the inset. Data shown are from one of three samples and two such independent experiments were carried out. Z scores comparing the modified low volume staining method to the 1.0 µg/100µl staining method are shown in Supplementary Table S1.

