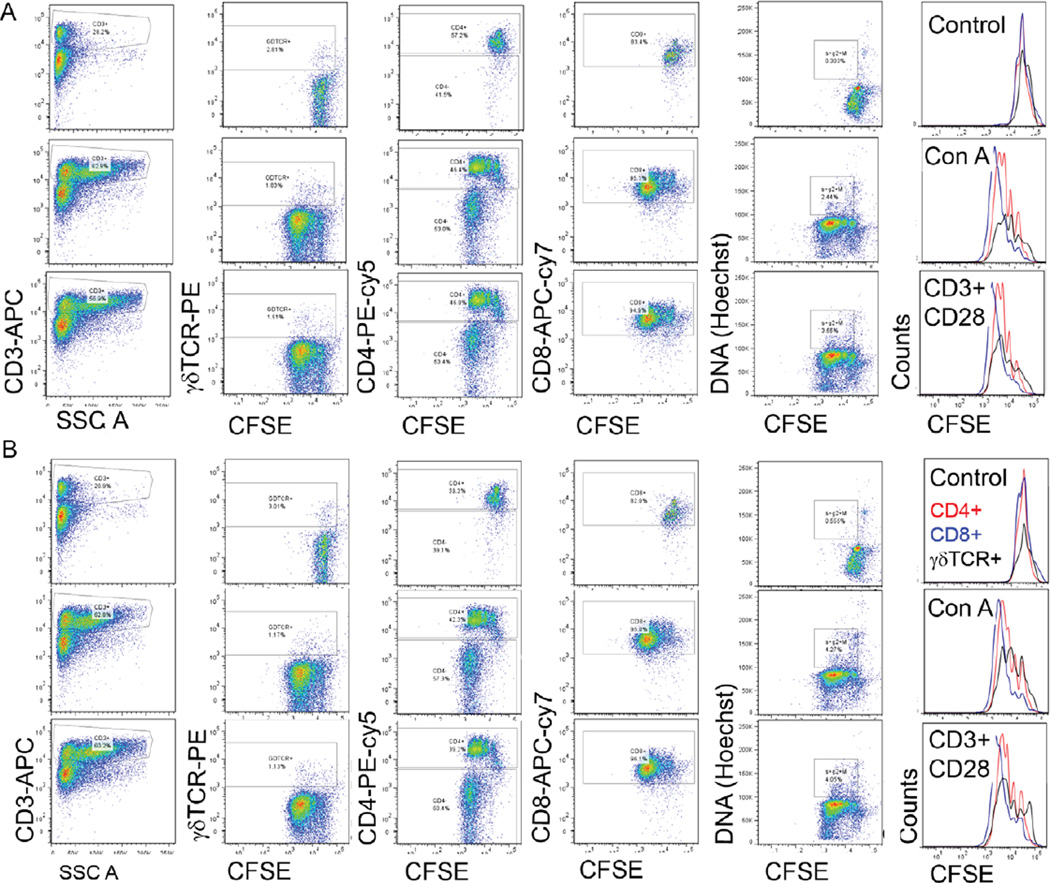
Figure 2. Six-color flow cytometric analysis of activated and proliferating T cells by the classical and modified methods for antibody staining.
Pseudo color dot plots showing CD3-APC, γδTCR-PE, CD4-PE-cy5, CD8-APC-cy7, and Hoechst staining in CFSE (1 µM) stained cells stimulated with concanavalin A (1 µg/mL; middle row) or plate bound CD3 (5 µg/mL) + soluble CD28 (1 µg/mL) antibodies (lower row) compared with unstimulated cultured cells (upper row). (A) Results of staining 2×10⁶ cells with 1.0 µg antibody in 100 µL and (B) 2×10⁶ cells with 0.2 µg antibody in 20 µL. On the right, overlaid histograms demonstrate the loss of CFSE fluorescence showing proliferation of CD4+ (red line), CD8+ (blue line), and γδTCR+ (black line) T cells. Data shown are from one of three samples and two such independent experiments were carried out.

