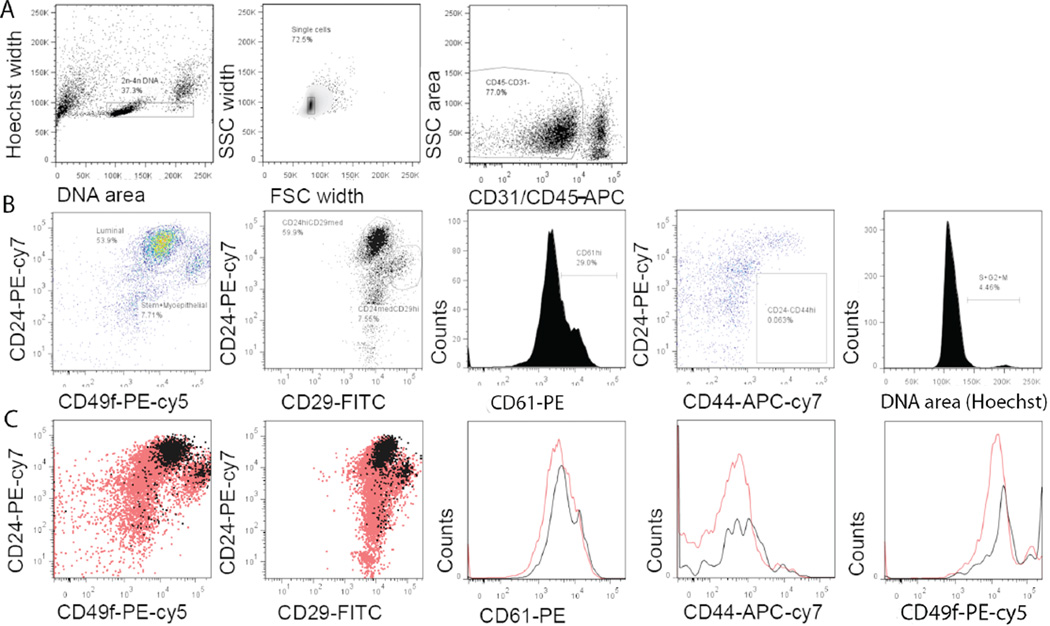
Figure 3. Flow cytometric characterization of mouse mammary epithelial cells stained by the modified method.
(A) Gating for live cells based on DNA content, separation of single cells by FSC width and SSC width, and gating for CD45-CD31- cells. (B) Pseudo color plot of CD24/CD49f expression, dot plot of CD24/CD29 expression, histogram of CD61 expression in luminal cells, pseudo color plot of CD24/CD44 expression, and histogram of DNA content for cell cycle analysis in CD45-CD31- mouse mammary epithelial cells. (C) Overlaid dot plots and histograms showing CD24/CD49f or CD24/ CD29, CD61, CD44, and CD49f expression in total CD45-CD31- cells (red) compared with actively dividing cells containing >2n DNA (black). Data shown are from one of six mice and three such independent experiments were carried out.

