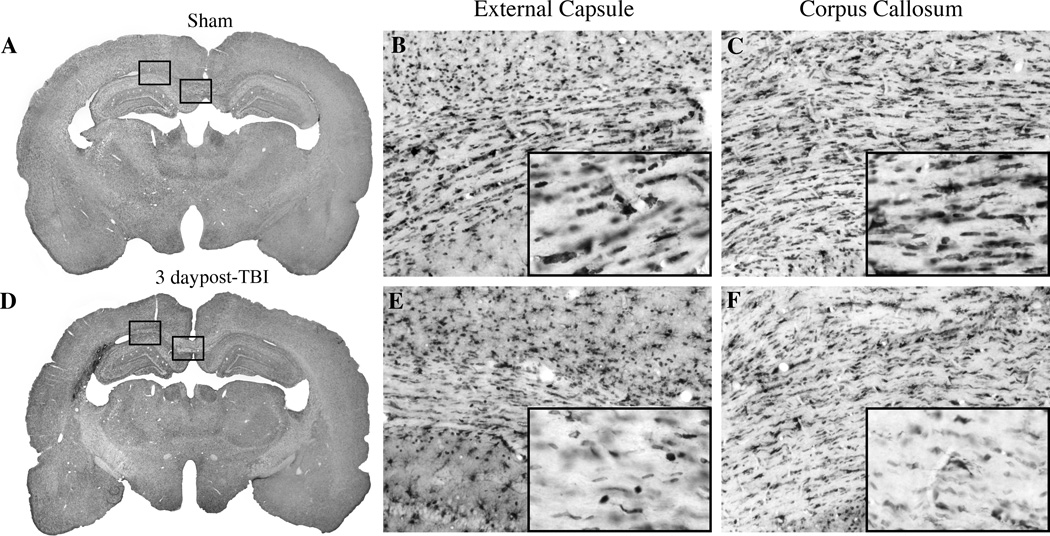
Figure 1.
Micrographs of CC1 immunoreactive oligodendrocytes. Sham (A) animal exhibiting robust staining of CC1 positive cells in the external capsule (B) and corpus callosum (C). In contrast, at 3 days post-TBI animal (D) shows reduced numbers of CC1 positive cells in the external capsule (E) and corpus callosum (F). Magnification 1X (A,D), 10X (B, C, E, F), inset of B, C, E, F (20X).

