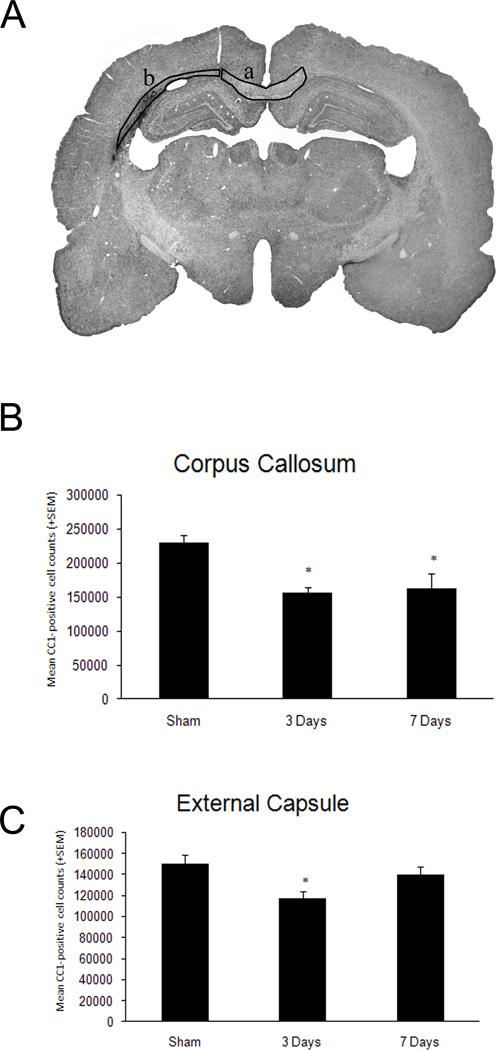
Figure 4.
Quantitative assessment of CC1 positive cells within vulnerable white matter regions. A. Representative micrograph indicating where the stereological cell counts were conducted, corpus callosum (a) and external capsule (b). B. T-test was significant (p<0.001) for both time points compared to sham in the corpus callosum. Both 3 and 7 day TBI animals showed significant (*p<0.001) reductions in CC1 positive cells compared to sham. C. T-test was significant (*p<0.02) for the 3 day TBI group compared to sham in the external capsule. These data demonstrate a reduction in the number of CC1 positive cells in the 3 day TBI group compared to sham.

