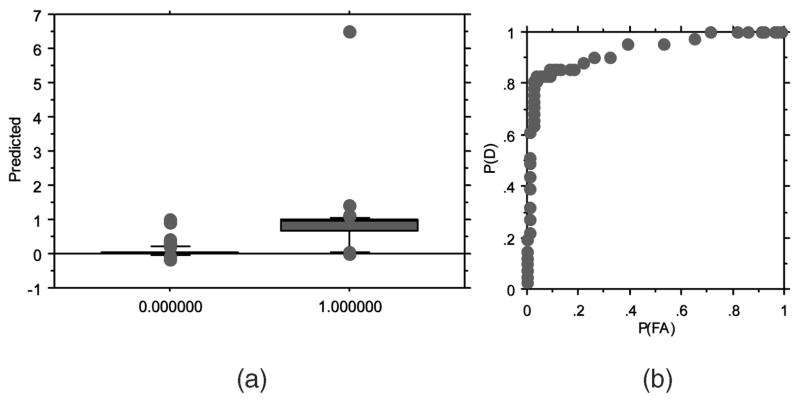
Fig. 4.
Results of leave-one-out cross validation on R5 versus X4 strains prediction. (a) Ability of the best neural networks to discriminate between R5 samples (0) and non-X4 samples (1). (b) The best probability of detection (P(D)) of 0.81 is achieved with a probability of false alarm (P(FA)) of 0.05 (area under the ROC curve A(z) = 0.927).

