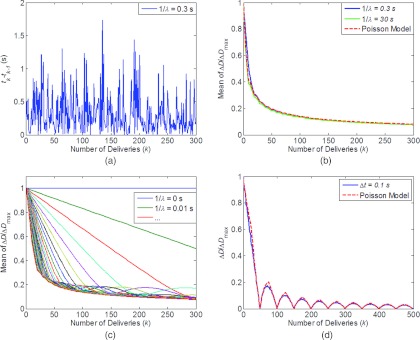
Figure 2.
Mean dose error (ΔD) as a function of number of deliveries (k), for pulsed beam. (a) Time intervals between two deliveries (tk−tk−1), modeled as an exponential distribution with 1/λ = 0.3 s. (b) Mean of (ΔD/ΔDmax) for 1/λ = 0.3 (30) s with different number of deliveries. (c) Mean of (ΔD/ΔDmax) for 1/λ = 0–0.3 s with different number of deliveries. (d) (ΔD/ΔDmax) for Δt = 0.1 s, as a function of number of deliveries. (ΔD/ΔDmax) as calculated with Poisson model in Eqs. 19, 23 were also shown in (b) and (d) with dash lines.

