
Figure 4.
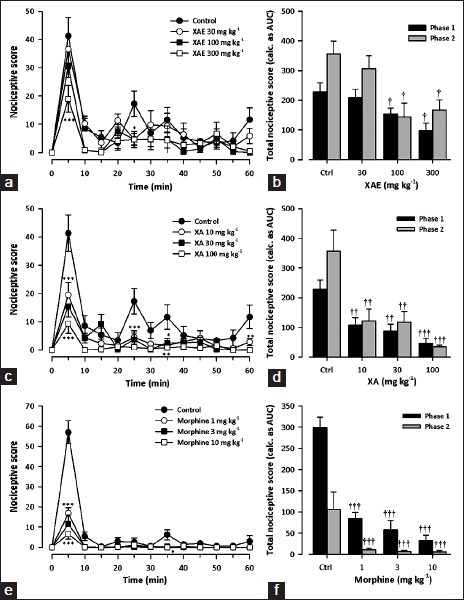
Effect of XAE (30-300 mg kg- 1), XA (10-100 mg kg-1) and morphine (1-10 mg kg-1) on the time course curves (a, c, e) and the total nociceptive score (calc. as AUCs) (b, d, f) of formalin-induced nociception in mice. Nociceptive scores are shown in 5 min time blocks up to 60 min for the time course curves. Data are presented as mean ± SEM (n = 8). *P < 0.05, **P < 0.01, ***P < 0.001 compared to control group (ctrl) (Two-way repeated measures ANOVA followed by Bonferroni's post hoc). †P < 0.05, ††P < 0.01, †††P < 0.001 compared to control group (ctrl) (one-way ANOVA followed by Newman-Keuls post hoc)