
Figure 5.
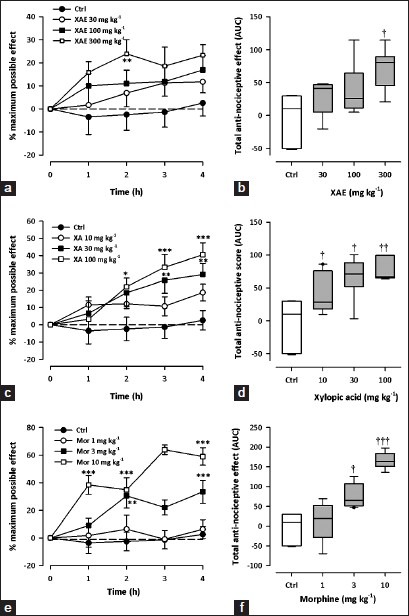
Effect of XAE (30-300 mg kg-1), XA (10-100 mg kg-1) and morphine (1-10 mg kg-1) on the time course curves (a, c, e) and the total anti-nociceptive effect (calc. as AUCs) (b, c, f) in the tail-flick test in mice. Data was presented as mean ± S.E.M. (n = 8). The lower and upper margins of the boxes (B, D, F) represent the 25th and 75th percentiles, with the extended arms representing the 10th and 90th percentiles, respectively. The median is shown as the horizontal line within the box. .*P < 0.05, **P < 0.01, ***P < 0.001 compared to control group (ctrl) (Two-way repeated measures ANOVA followed by Bonferroni's post hoc). †P < 0.05, ††P < 0.01, †††P < 0.001 compared to control group (ctrl) (one-way ANOVA followed by Newman-Keuls post hoc)