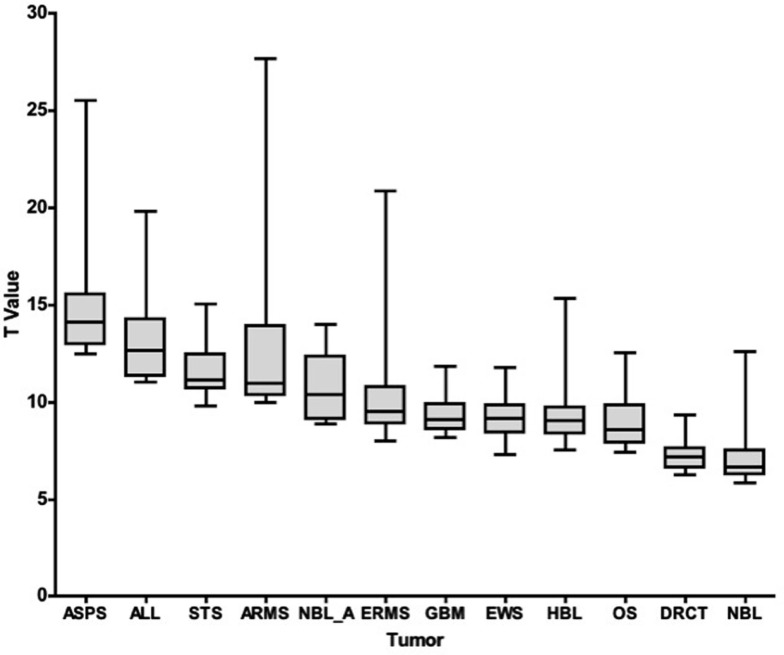
Figure 1.
T-Statistic overview of the top 25 tumor-specific transcripts. For each disease category (listed on the x-axis), the range of T-statistic values for the 25 membrane proteins most different from normal tissue, along with their average and quartiles, is represented as a box and whisker plot.

