Figure 4.

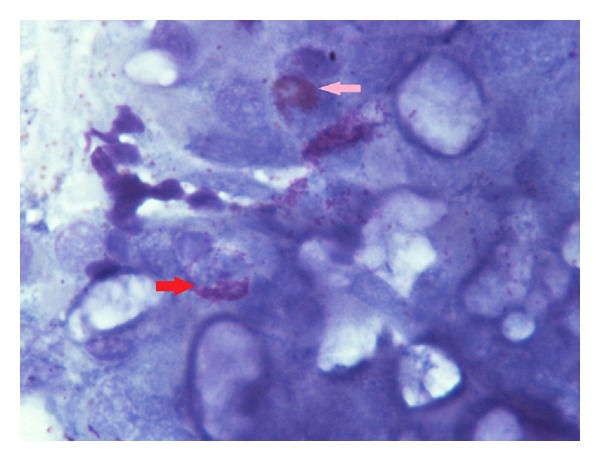
Control group (score 3) rhinocytogram before treatment. Eosinophil cells (pink arrow) and mast cells (red arrow) observed with large areas of degranulation.

Control group (score 3) rhinocytogram before treatment. Eosinophil cells (pink arrow) and mast cells (red arrow) observed with large areas of degranulation.