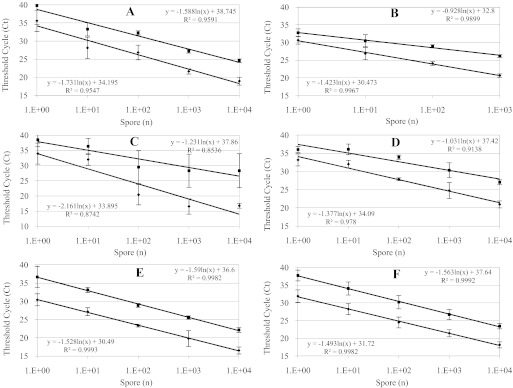
FIGURE 2.

Real-time qPCR results of Ct versus number of spores (n) from which the template gDNA was extracted. A. alternaria (A), A. fumigatus (B), C. cladospooides (C), P. chrysogenum (D), S. chartarum 5108 (E), and S. chartarum 5111 (F). Each plot represents an average of three independent experiments amplifying rRNA (lower curves) and β-tubulin (upper curves). r was calculated for each plot.
