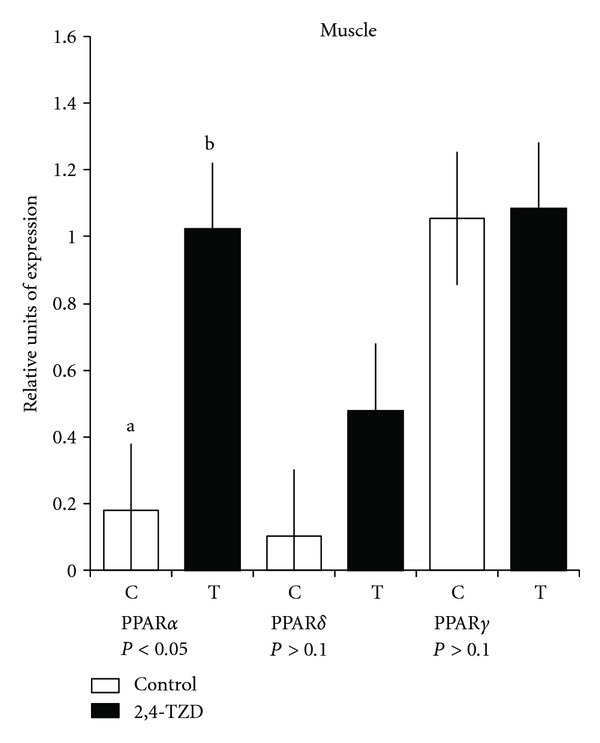
Figure 2.

Quantitative polymerase chain reaction (qPCR) of peroxisome proliferation-activated receptors (PPAR)α, -δ, and -γ in the muscle. Columns show relative expression of PPAR (α, δ, and γ) in Control (C) and Thiazolidinedione (TDZ) (T) groups. a,bDifferent lowercase letters indicate a significant difference.
