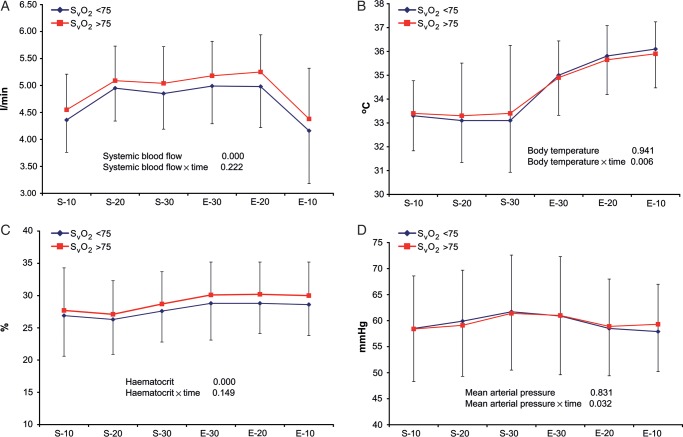
Figure 1:
SvO2 level in relation to specific physiological parameters. Depiction of systemic blood flow (A), body temperature (B), haematocrit (C) and mean arterial blood pressure (D) at SvO2 below or above 75% during cardiopulmonary bypass (CPB). P-values (ANOVA) represent group differences based on the SvO2 level and interaction effects of included time periods. S10–S30 denote commence and E30–E10 termination of CPB each with a time frame of 10 min (means ± SD).

