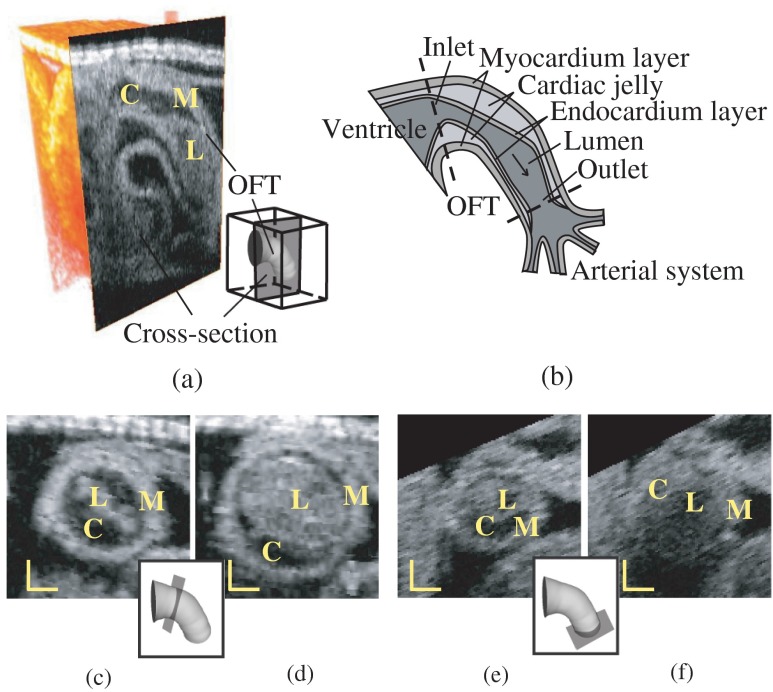
Fig. 1.
Structure of the heart outflow tract (OFT). (a) 3-D image set acquired with OCT, showing a longitudinal OFT section. (b) Sketch of the OFT showing its wall layers, as well as proximal and distal connections. The arrow shows the direction of blood flow. (c) and (d) Cross-sectional images at the inlet of the OFT during maximal contraction and maximal expansion. (e) and (f) Cross-sectional images at the outlet of the OFT during maximal contraction and maximal expansion. M: myocardium; C: cardiac jelly; L: lumen. Scale bars: 100 μm.

