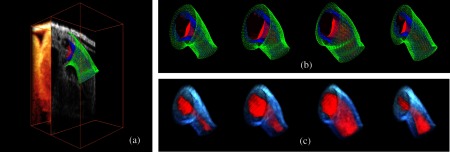
Extracted 4-D OFT shapes over one cardiac cycle. (a) Extracted OFT layers (represented as surface meshes) versus the original image at time 0 ms; see also (Video
1, MOV, 7.96 MB) [URL:
http://dx.doi.org/10.1117/1.JBO.17.9.096005.1] showing the steps of the segmentation procedure. (b) and (c) Extracted results at times 95 ms, 190 ms, 285 ms, and 370 ms (cardiac cycle is 370 ms). Due to the periodic motion of the heart, the shape of the OFT at time 370 ms was the same as at time 0 ms. (b) OFT myocardial and endocardial surfaces; see also (Video
2, MOV, 9.30 MB) [URL:
http://dx.doi.org/10.1117/1.JBO.17.9.096005.2] showing the motion of extracted surfaces (green: outer myocardium surface; blue: inner myocardium surface; red: endocardium/lumen surface). (c) 3-D volume data images of the OFT; see (Video
3, MOV, 7.67 MB) [URL:
http://dx.doi.org/10.1117/1.JBO.17.9.096005.3] showing the motion of the heart from the extracted volume data (red: lumen; blue: myocardium, showing intensity levels in shades of blue).

