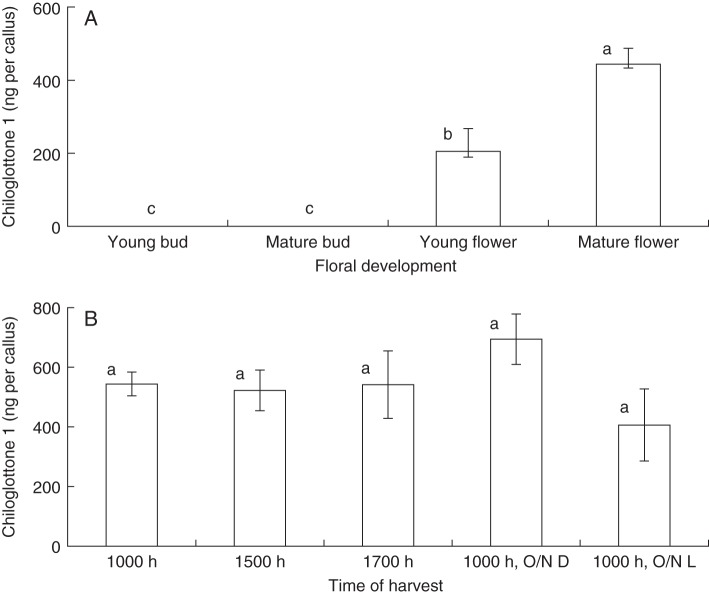
Fig. 2.
The levels of chiloglottone 1 in buds and flowers of C. trapeziformis (A) at different developmental stages and (B) at different time points over a period of 24 h. For the treatment “O/N D” flowers were covered with aluminium foil at 1700 h to ensure complete darkness overnight until 1000 h the following day; for the treatment “O/N L”, flowers were exposed overnight to the evening and morning light until 1000 h the following day. Error bars are standard errors of the mean based on pooled estimate of error variance. Labelled columns not connected by the same letter are deemed significantly different at P < 0·05, based on a Tukey–Kramer HSD test. Outcomes of ANOVA: (A) F3,18 = 25·7, P < 0·0001; (B) F4,16 = 1·4, P = 0·2696.

