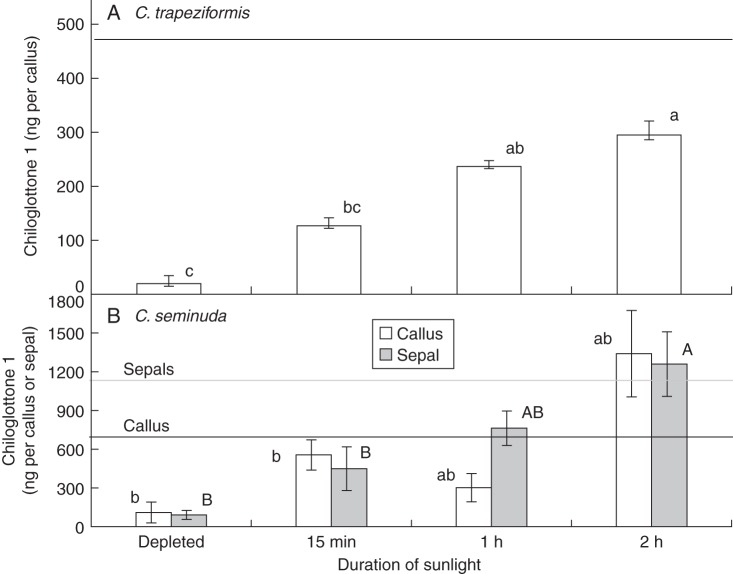
Fig. 3.
The time-dependent increase in chiloglottone 1 levels following exposure to sunlight in previously depleted flowers of C. trapeziformis and C. seminuda. Horizontal lines represent the average chiloglottone 1 levels detected under continuous exposure to sun (460 ng per callus, n = 29 for C. trapeziformis; 706 ng per callus and 1070 ng per sepal, n = 14 for C. seminuda). Error bars are standard error of the mean based on pooled estimate of error variance. For ease of comparison, chiloglottone 1 levels in C. seminuda are shown for both callus and sepals in the same graph (B); however, statistical comparisons can only be made within the respective tissue types. Labelled columns not connected by the same letter of the same case are deemed significantly different at P < 0·05, based on a Tukey–Kramer HSD test. Outcomes of ANOVA: for C. trapeziformis (A) F3,26 = 19·2, P < 0·0001; for C. seminuda (B) callus F3,23 = 4·8, P < 0·009 and sepals F3,22 = 6·2, P < 0·003.

