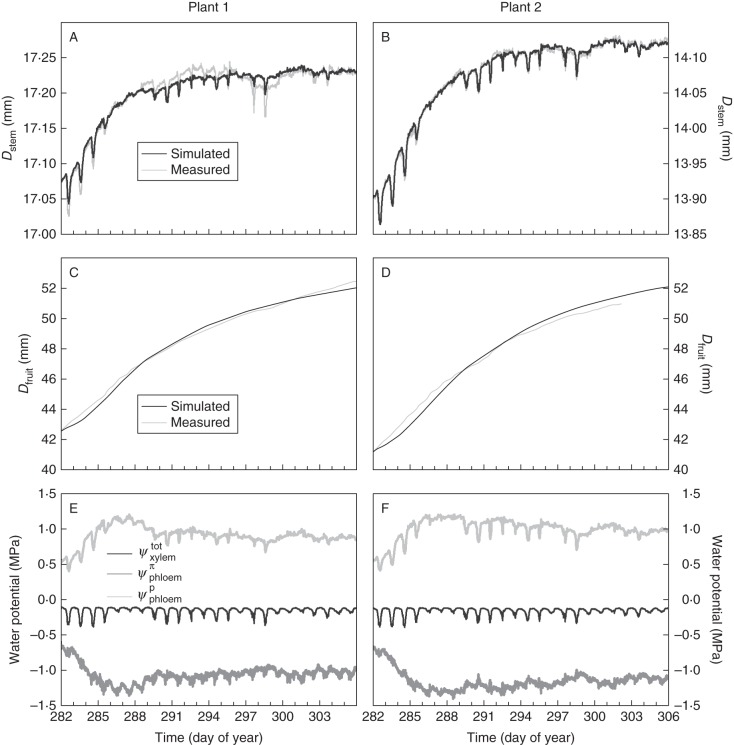
Fig. 5.
(A, B) Simulated and measured stem diameter (Dstem) for level 2 (above the oldest four leaves), (C, D) simulated and measured fruit diameter on the second truss (Dfruit) and (E, F) simulated xylem water potential (Ψtotxylem), phloem osmotic potential (Ψπphloem) and phloem hydrostatic potential (Ψpphloem) for plant 1 and plant 2 plotted against time.

