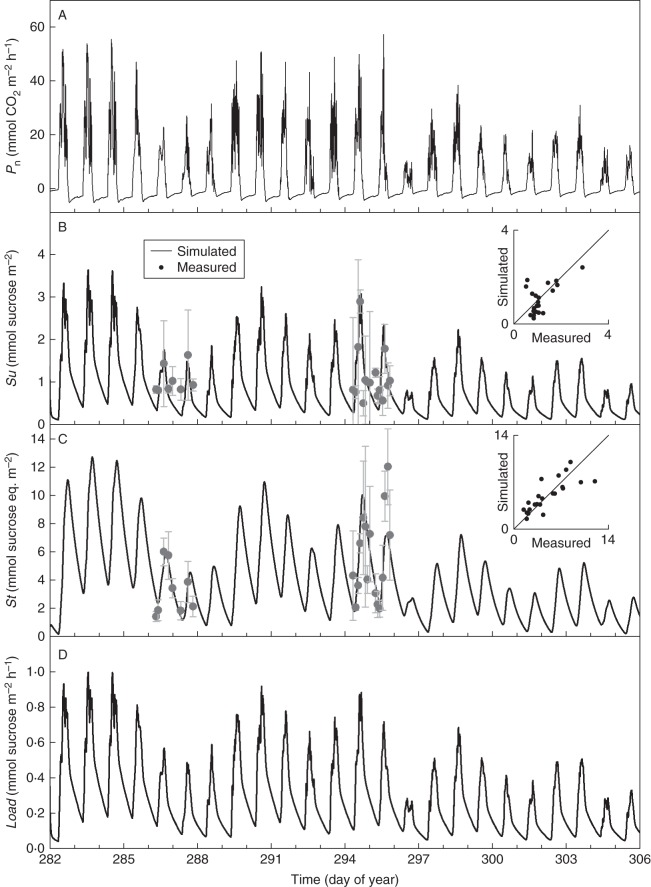
Fig. 7.
Simulated net photosynthesis rates (Pn), simulated and measured concentrations of sucrose (Su), simulated and measured concentrations of storage carbohydrates including starch and hexoses (St) and phloem loading rates (Load) for leaves in the second leaf layer, plotted against time. Error bars indicate the standard deviation on four samples.

