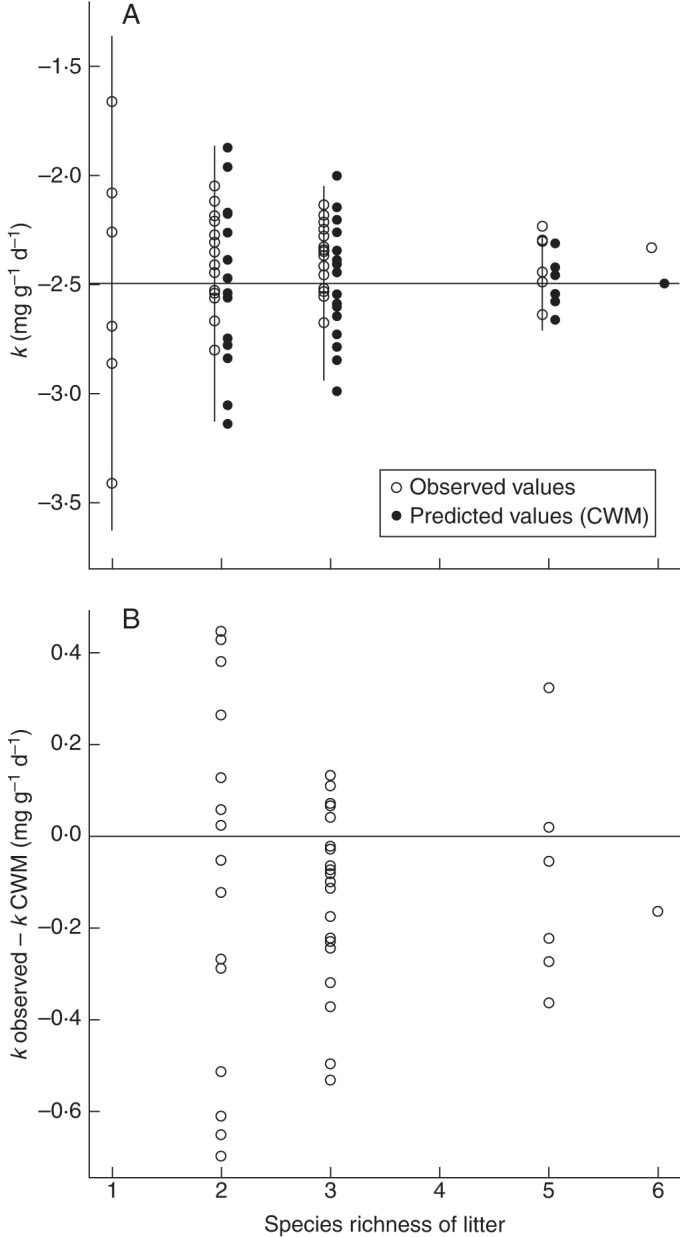
Fig. 1.

(A) The measured decomposition rates (‘observed’) and the calculated community-weighted mean (CWM) values (‘predicted’) are plotted against the number of species in the litter mixture. The horizontal line is the expected value of the measured rates based on the monoculture values, and the vertical lines show the expected variation (± 2 s.d.), assuming the biomass-ratio hypothesis and normally distributed monoculture rates. (B) Deviations from CWM values due to interactions between species.
